
People in finance often need to use foreign exchange rates in their calculations. Since Power BI is the ultimate automated reporting solution, it makes sense to find a way to get FX rates into Power BI as easily as possible.
Table of Contents
- Get FX rates into Power BI
- Custom function to get FX rates
- Using the custom function
- Dealing with increasing data
- Warnings
Get FX rates into Power BI
XE.com is an excellent source of historical exchange rates. The website has FX data in HTML tables that are easily read by Power Query. In this post, this is the source we use to get FX rates into Power BI.
Let’s get started.
Go to https://XE.com and find the historical rates section. Assuming the website has not changed, these are the steps:
- Click Tools > Historical Currency Rates [1],[2]
- Select the base currency, select a date and click Confirm [3]
- A table of currency rates is displayed [4]
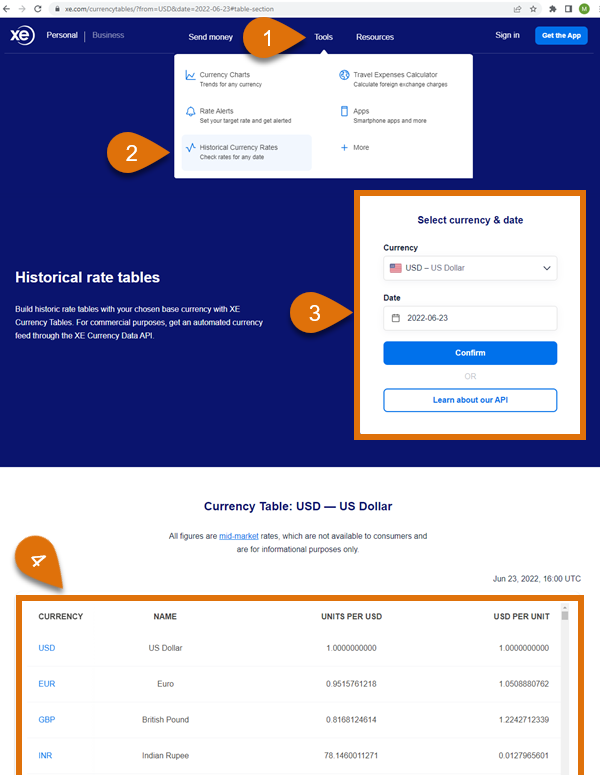
The URL for this page is the key piece of information we need.

Within that address, we can see the base currency and the date we selected (both highlighted below).
https://www.xe.com/currencytables/?from=USD&date=2022-06-23#table-section
Copy the URL from your web browser, apart from the section after the #; we don’t need that part.
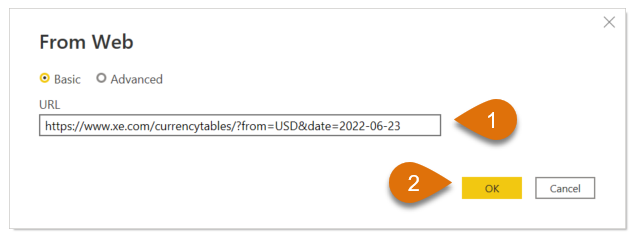
In Power BI, go to Home > Get Data > From Web
Enter the URL into From Web dialog box [1], then click OK [2]
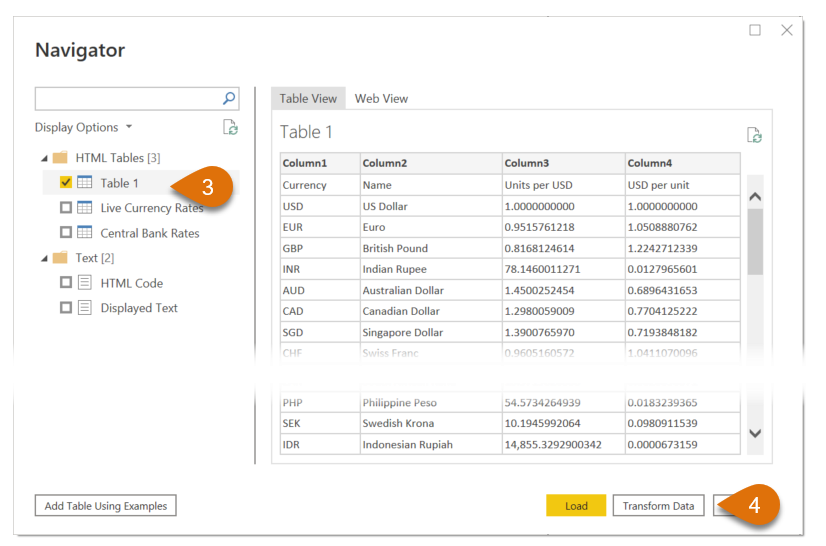
Next, in the Navigator window, select Table 1 [3] (this is the table on the web page that contains the FX rates).
Click Transform Data [4].
This is how we can get FX rates into Power BI easily.
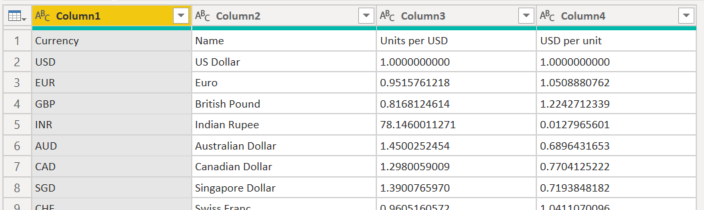
Now, we just need to undertake a few simple transformations:
- We only need one way of converting the currency, so delete either Column 3 or Column 4.
- Promote headers by clicking Transform > Use first row as headers
The column names come directly from the HTML table on XE.com. If we use other base currencies, our query might break as the currency is already included in the header. It is best to rename the column by position to avoid the changing column header issue. Check out this post on how to rename columns by position.
Our final rates table now looks like this:
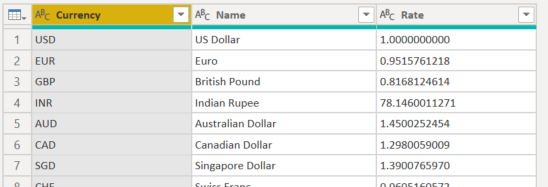
Custom function to get FX rates
We’ve found out how to get currency rates for a single day. But what if we want currencies for every day in a period? For that, we can create a custom function.
I’m not going to take you through creating custom functions in Power Query. Instead, I’ll give you the completed function and show you how to use it.
Custom function
Create a blank query called fxGetFXRates and enter the text below in the advanced editor:
(Date as date, BaseRate as text, optional CurrencyList as list)=>

let
//Create YYYY-MM-DD Format from date
TextDate = Date.ToText(Date,"YYYY-MM-DD"),

//Connect to XE.com web page
#"Get web data" = Web.Page(Web.Contents(
  "https://www.xe.com/currencytables/?from="&BaseRate&"&date="&TextDate)),
  #"Filter to FX table" = Table.SelectRows(
  #"Get web data", each ([Caption] = null)){0}[Data],

//Rename Rate columnn
#"Rename rate column" = Table.RenameColumns(#"Filter to FX table",
  {{Table.ColumnNames(#"Filter to FX table"){2}, "Rate"}}),

//Remove unwanted columns
#"Remove unwanted columns" = Table.SelectColumns(
  #"Rename rate column",{"Currency", "Name", "Rate"}),

//If Currency List provided then use, else everything
#"returnTable" = if CurrencyList is null
  then #"Remove unwanted columns"
  else Table.SelectRows(#"Remove unwanted columns",
    each (List.Contains(CurrencyList,[Currency])=true))

in
#"returnTable"
The function has 3 arguments:
- Date: The date for which to retrieve the exchange rates. This must be a date data type.
- BaseRate: This is the base currency code (e.g., USD, GBP, EUR, CAD, AUD, etc.).
- CurrencyList: This is an optional list of currencies to be returned; if no list is provided, all currencies are returned. This list can be a separate list query or a simple text list (e.g. {“GBP”,”AUD”}).
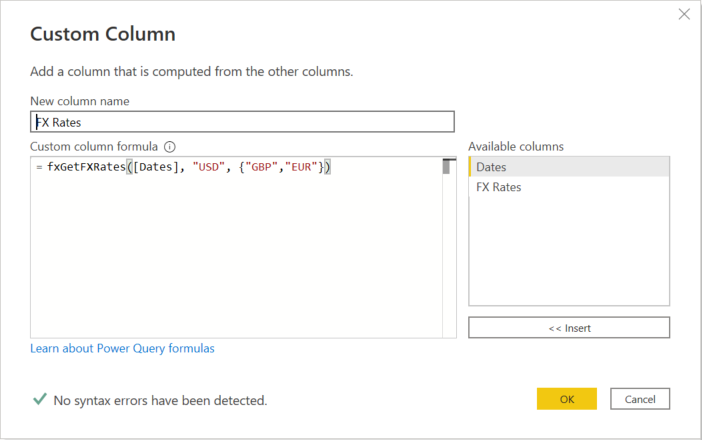
Using the custom function
The custom function above is applied by adding a custom column. In the screenshot below, [Dates] is a column containing dates, the base currency is USD, and GBP and EUR rates are the currencies to be returned.
Example scenario to get FX rates for each day
Below is a fuller example of using the custom function in a real scenario.
Start Date
Create a query called Start Date with the following M code:
= Date.From("01/01/2022")This represents the date from which to start obtaining FX Rates. Change this to fit your requirements.
End Date
Create another query called End Date with the following M code:
= Date.From(DateTime.LocalNow())This represents the current date.
Create a date table, then apply the custom function for each day
We create a date table using the Start Date and End Date queries. Then, we apply the custom function for each day in that date table.
Here is the code for these steps (the section calling the custom function has been highlighted).
You can copy this code into a new blank query to see it in action.
let

//Create a list of dates from the start date to yesterday
Source = List.Dates(StartDate,Duration.Days(
  EndDate - StartDate),#duration(1,0,0,0)),

//Convert the list to a Table
#"Convert List to Table" = Table.FromList(Source,
  Splitter.SplitByNothing(), null, null, ExtraValues.Error),

//Rename Column1 to Dates
#"Rename the Date column" = Table.RenameColumns(
  #"Convert List to Table",{{"Column1", "Dates"}}),

//Change the Date column to a Date type
#"Change Date column to date type" = Table.TransformColumnTypes(
  #"Rename the Date column",{{"Dates", type date}}),

//Call the custom function
#"Run the custom function" = Table.AddColumn(
  #"Change Date column to date type", "FX Rates",
  each fxGetFXRates([Dates],"USD",{"GBP","EUR"})),

//Expand the custom function to show the Currency, Name and Rate
#"Expand the custom function table" = Table.ExpandTableColumn(
  #"Run the custom function", "FX Rates", {"Currency", "Name", "Rate"},
  {"Currency", "Name", "Rate"}),

//Set the data Types
#"Change the data types" = Table.TransformColumnTypes(
#"Expand the custom function table",{{"Currency", type text},
{"Name", type text}, {"Rate", type number}})

in
#"Change the data types"
Dealing with increasing data
The custom function is running the web query over and over. Since web queries are not the fastest, the query run time will get longer as more dates are added.
Since we are obtaining historical exchange rates, the values won’t change. So, if refresh times start to become an issue, you can copy the query results into an Excel workbook every few months. Then, create an appending query that uses:
- Excel workbook of historical rates
- Custom function to capture any rates not in the Excel workbook
Warnings
This sounds great, but there are a few things to be aware of.
XE.com is a website outside of our control. Therefore, if XE.com change their website, the custom function may cease to operate correctly. However, the principles in this post should help you get FX rates from other sources too.
For any financial people, it’s important to save down a hard-coded copy of the query results at the end of the year. This is the only way to guarantee that you can re-create the same FX calculation results for audit purposes.
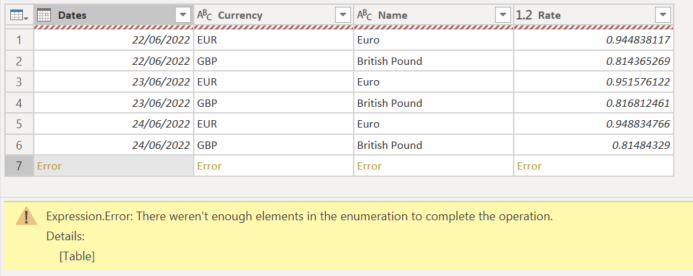
If you try to execute the query for dates in the future, it will create an error.
Using this method, it uses a dynamic data source (i.e., the source of the query is not fixed). Therefore, using this method, it is not possible to perform a scheduled using Power BI.
Other resources
If this method didn’t meet your needs, here are some other resources that you might find helpful: